Explore Maui's Water Quality
|
The various color markers on the map indicate sites monitored by volunteer teams. Currently, there are 6 teams total. The black dots signify sites the Hui used to monitor but are now discontinued, and grey dots are sites where monitoring is currently paused.
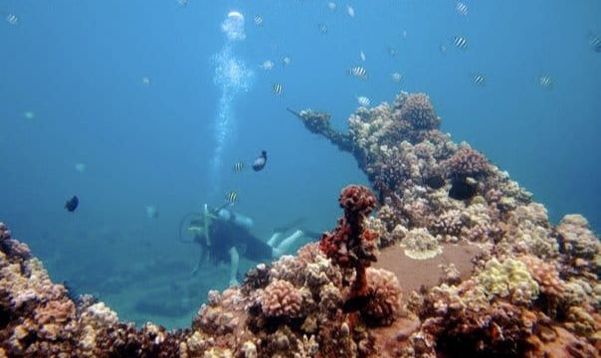
Why we careOur health is tied to the health of the ocean. When we surf, dive, and fish in clean water, eat healthy seafood, and enjoy an unpolluted beach we are benefiting from good water quality. In other words, the quality of our water equals the quality of life!
When water quality is poor, our environment and communities follow suit. Sediments, nutrients, and other pollutants from land-based sources can create chronic water quality issues that we can identify via monitoring. Testing nearshore water samples gathered along Maui's coastline allows us to identify and focus efforts in the places that need them most. By comparing changes in reef health to changes in water quality, we are able to better understand the major factors that are contributing to reef declines. Learn More |
What we are testingWe look for sediments, nutrients, and other pollutants from land-based sources that might be having a negative impact on water quality. We collect data for ocean salinity, pH, temperature, total nitrogen, nitrate-nitrite nitrogen, ammonium, total phosphorus, phosphate, silicates, dissolved oxygen (DO) and turbidity. Some water samples are immediately tested at mobile labs, while others are processed for testing at University of Hawaiʻi [and/or other] labs.
Our sample sitesWe currently monitor 29 sites on Maui, including 16 sites in West Maui from the Pāpalaua Pali to Honolua and 13 sites in South Maui from Mā'alaea to 'Āhihi Kīna'u. These sites have available water quality data for your watershed from the efforts of both volunteers and the Department of Health (DOH).
As funding and our volunteer community grows, we will expand our efforts into other water quality research, such as source detection and working with partners to delve deeper into some of the pollution “hot spots” our data has helped identify. We also hope to expand monitoring to other areas . |
Available DataExplore our findings, and if you prefer, download data and conduct your own analyses. Note that the data remains provisional.
DownloadStep 1Please let us know a little about yourself and what you hope to use the data for. You can contact [email protected] if you have additional questions. |
|
|
Great advice from the Hawai'i DOH -
IF THE WATER IS BROWN STAY OUT! Storm water runoff starts far up in the watershed. This water can pick up all kinds of contaminants as it travels towards the ocean. Please heed the advice from the DOH and don't head to the beach to swim, snorkel, or surf when storm water has been running into the ocean. Even if the DOH hasn't issued a brown water advisory, IF THE WATER IS BROWN STAY OUT! |
Additional Data and AdvisoriesDownload Hui O Ka Wai Ola's 2016-2018 Coastal Water Quality Report for our latest data! Visit the Department of Health's (DOH) Clean Water Branch site for DOH Water Quality Data and DOH Water Quality Advisories. |
Explore Our Findings
Maps and Graphs of Findings
Sites with available water quality data for your watershed, from both the efforts of volunteers and the Department of Health.
|
Turbidity (brown dots on map): Turbidity readings using the Hach 2100Q Turbidimeter, calculated from June to November using geometric means. Units are NTU. High turbidity indicates sediment in the water.
Nitrate (color dots on map): Nitrate concentrations for Hui O Ka Wai Ola sites, calculated using a geometric mean. Also included are the DOH data for sites not monitored by the Hui. All values are in ug/L. |
Spatial data: Cess pool and sewer infrastructure data available courtesy of the Department of Health (Whittier, 2009). Irrigation ditch and golf course data available from the State Office of Planning GIS repository. Stream layers from the National Hydrography dataset. Basemap from ESRI.
For more information on these maps, please contact [email protected]. |
Is the stream flowing?
The graph below shows the current stream flow for Honokohau, Maui
(measured from the nearest functioning stream gauge in west Maui).
Big spikes in the graph mean more water flow in Honokohau, which
can also mean possible stream flow in Wahikuli and transport of
pollutants into coastal waters from these areas.
(measured from the nearest functioning stream gauge in west Maui).
Big spikes in the graph mean more water flow in Honokohau, which
can also mean possible stream flow in Wahikuli and transport of
pollutants into coastal waters from these areas.
Photos: Header, Why we care - The Nature Conservancy (Alana Yurkanin)


